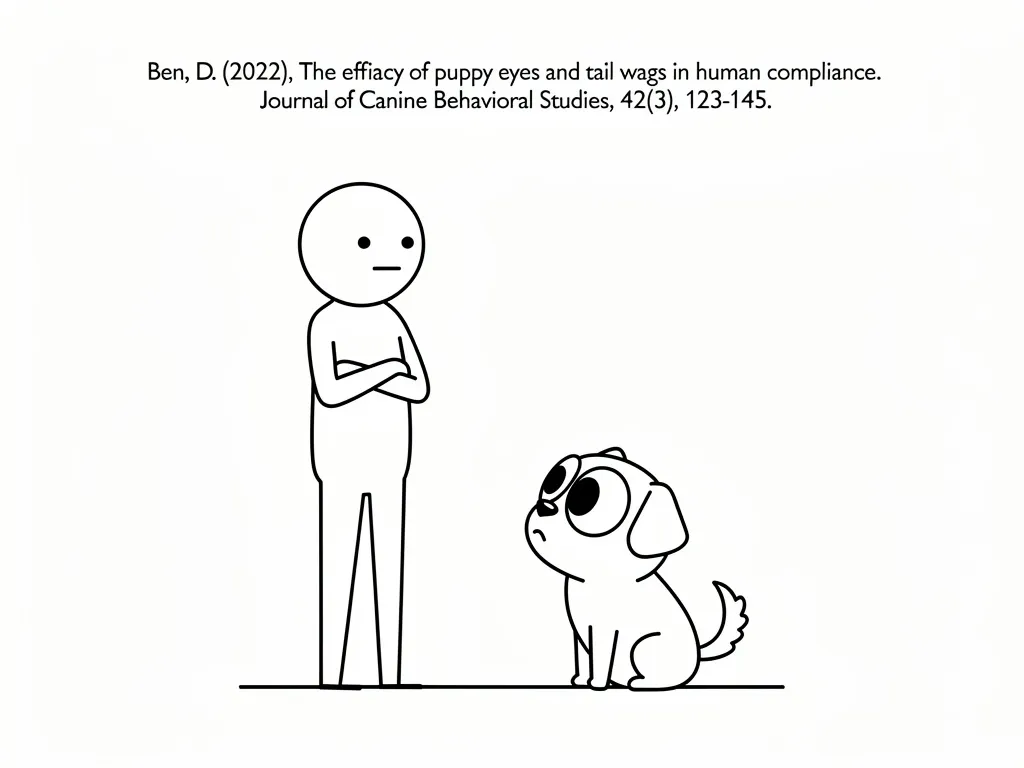
Hello, data-loving dogs and humans. I’m Ben, and today I’ll show you how I used basic data analysis to increase my treat intake. Spoiler: it involves cuteness and R.
Step 1: Collect Data
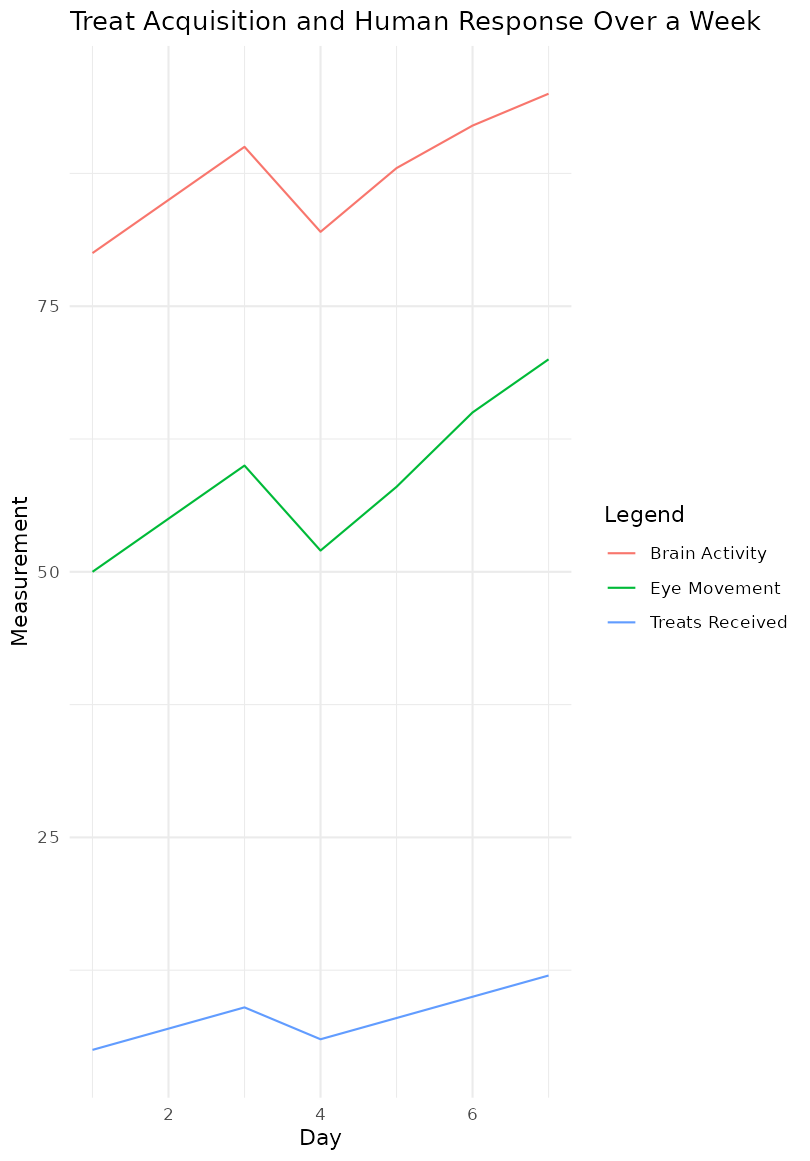
I tracked my daily treats and human reactions. Here’s the code:
# Sample code for tracking treats and human response
treats <- data.frame(
  day = 1:7,
  treats_received = c(5, 7, 9, 6, 8, 10, 12),
  brain_activity = c(80, 85, 90, 82, 88, 92, 95), # Measured in cuteness units
  eye_movement = c(50, 55, 60, 52, 58, 65, 70) # Number of times humans glance at me
)

# Plotting the data
library(ggplot2)
ggplot(treats, aes(x = day)) +
  geom_line(aes(y = treats_received, color = "Treats Received")) +
  geom_line(aes(y = brain_activity, color = "Brain Activity")) +
  geom_line(aes(y = eye_movement, color = "Eye Movement")) +
  labs(title = "Treat Acquisition and Human Response Over a Week",
       x = "Day",
       y = "Measurement",
       color = "Legend") +
  theme_minimal()
Step 2: Visualizing the Results
Let’s take a look at the results. Here’s a plot showing the number of treats I received, along with the brain activity and eye movement of my human subjects over a week. As you can see, the more I perfected my cuteness techniques, the more treats I got and the more my humans were mesmerized!
Step 3: Applying Advanced Techniques
My secret weapon? The Inquisitive Submarine:
Be visible and signal interest.
Pretend to respect human boundaries (until the food is ready).
Maintain eye contact. Denying treats at this point would feel like betrayal.
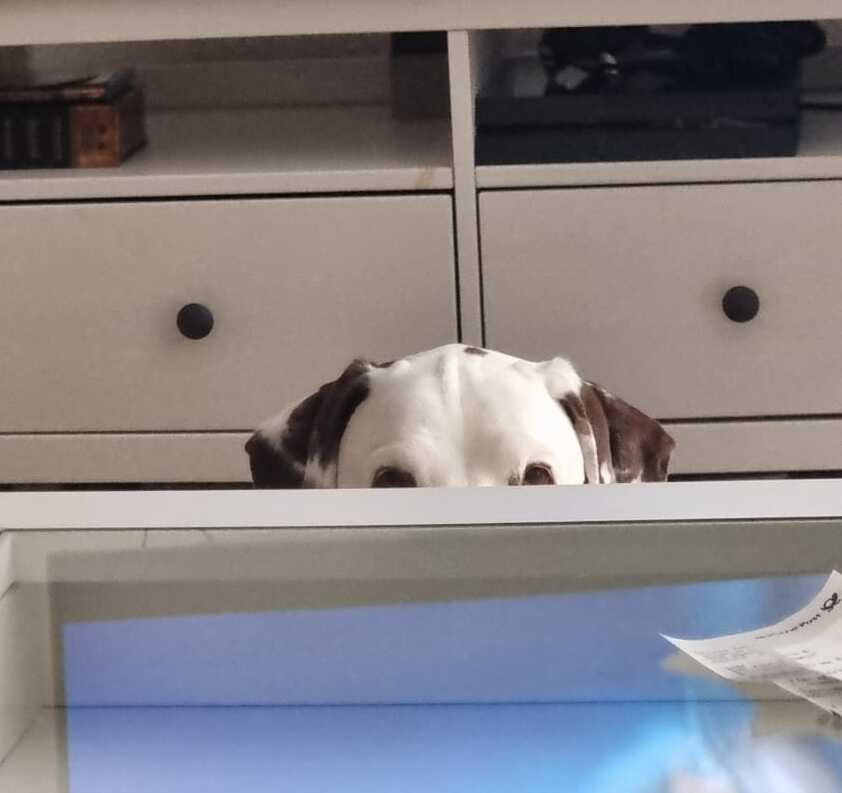
Pro Tip: Always maintain eye contact. It creates a stronger bond and increases your chances of getting treats. Also, don’t use this technique when you’re desperate. You’ll probably be as subtle as a tanker.
Conclusion
With practice, I increased my treat allocation. Stay tuned for more insights and paws-on research.